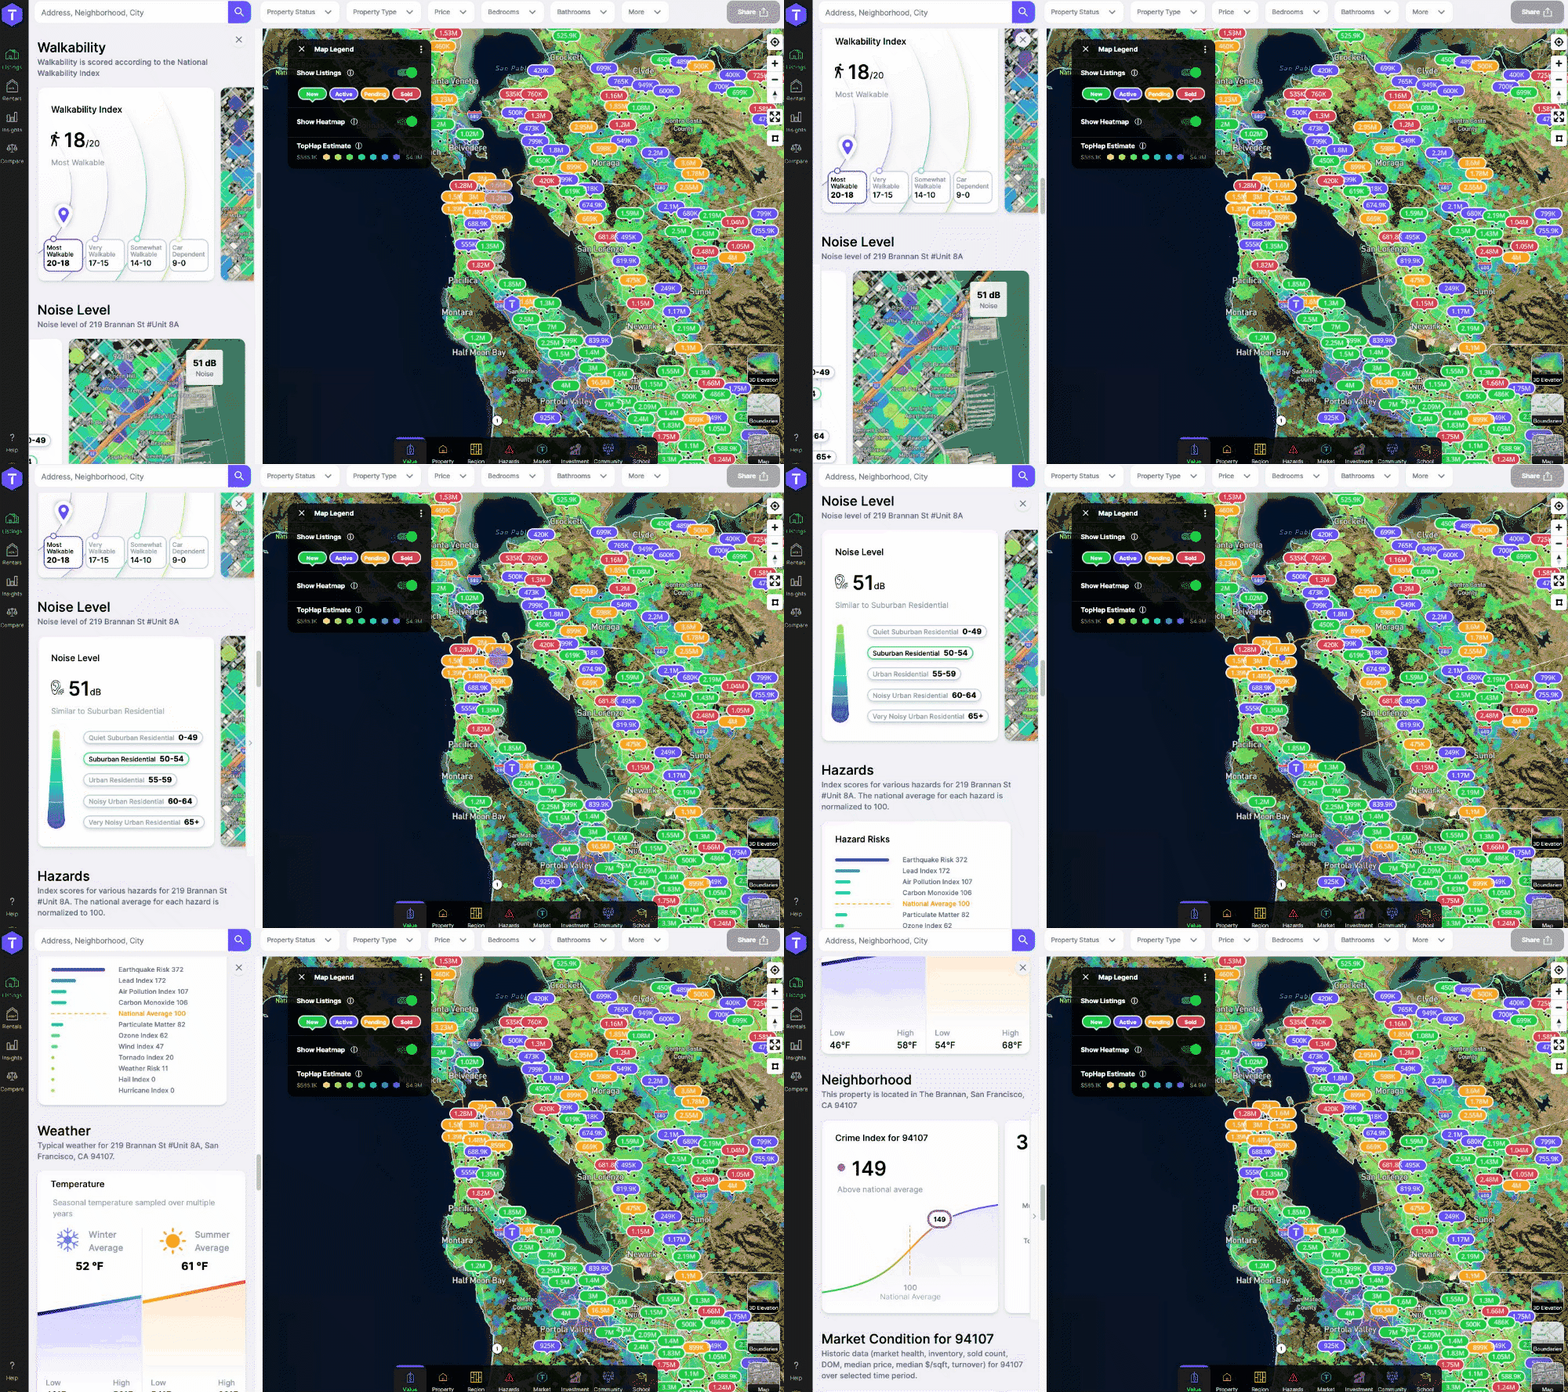
TopHap’s approach is heavily strategic and long-form. This is data at a higher level, offered in a visually addicting, presentation-ready format for understanding everything below and above the surface of real estate.
Real estate data visualization company TopHap has unveiled a number of new features to its map-based property information platform.
Earning five stars in its initial Inman review about two years ago, TopHap continues to show the industry the raw power of its data. In what might be a surprise to some, however, is that TopHap isn’t using it to generate leads or create dynamic ads for Facebook.
TopHap’s approach is heavily strategic and long-form. This is data at a higher level, offered in a visually addicting, presentation-ready format for understanding everything below and above the surface of real estate.
The company launched a mobile app for iOS in September that uses visual recognition of properties to initiate research.
Users need only point their phone’s camera at a property for the app to engage the iPhone’s GPS and gyroscope, which identifies the address to pull in its data sets and apply the many property information tools TopHap offers.
The company has also enhanced its suite with a series of new and updated widgets to help users, according to TopHap, “dive deep into any property.”
The Market Condition gauge has been bolstered with a scale for peering into a ZIP code’s months of available inventory. Market conditions will be rated as “buyer,” “seller” or “balanced.”
Within the Market Condition tool is the Absorption Rate widget, which displays the percentage of listed homes that were sold each month for the target property’s ZIP code.
The new Turnover metric helps agents understand the annual percentage of sold total homes in a specific the neighborhood, and the Permits view looks into the comprehensive municipal permit history of a property, which includes the organizations that filed them.
Those agents who want help contacting owners of off-market homes might like the Current Ownership screen. It identifies owner name or organization, tax data, equity changes and dates owned.
As is characteristic of TopHap, each of the new widgets is subject to the company’s superb UI/UX, which make its data visualizations so much fun to navigate and learn from.
The blending of public and private data is now a part of every great proptech solution on the market. It can be molded to fit into any number of business use cases, so many in fact that using it to merely find names of possible buyers seems pedestrian. Agents need to find new ways to add value, and there’s endless amounts of value in better understanding the metrics of your market.
That’s what TopHap offers.
I wrote in 2020 that the only thing really holding this app back from acquisition is it that it’s availability is limited to California.
Let’s hope 2022 finds TopHap outside the borders of The Golden State.


 Are You Interested in West Eleventh Residences Miami?
 Are You Interested in ONE Park Tower by Turnberry?
 Are You Interested in Diesel Wynwood Condominium?
 Are You Interested in Five Park Miami Beach?
 Are You Interested in Cipriani Residences Miami?
 Are You Interested in Bentley Residences Miami?
 Are You Interested in Baccarat Residences Brickell?
 Are You Interested in Aria Reserve Miami?
 Are You Interested in 888 Brickell Dolce & Gabbana | Miami?
 Are You Interested in 600 Miami WorldCenter?
 Are You Interested in HUB MIAMI RESIDENCES?
 Are You Interested in WALDORF ASTORIA RESIDENCES?