A three-point jump in mortgage interest rates coupled with soaring inflation and tanking stock market prices has taken today’s real estate market into unprecedented territory. In this new environment, relying on comparable sales that are 60 to 120 days old no longer reflects the realities of today’s market.
If you’re still doing your CMAs the same way you have for the last 12 years, your next CMA will probably flop. The reason is your MLS comparable sales are based upon transactions that went under contract at least 45-60 days ago. If you’re using sales that closed during the last 90 days, i.e., April-June, the bulk of those properties came on the market in February or March when the mortgage interest rates were still at 3.22 percent.
In other words, the huge run up in interest rates means your MLS simply doesn’t have sales data right now that reflects today’s higher interest rate environment.
Snagged in the lag
Since 1980, there have been four downturns. In each of these downturns, prices continued to increase for six to 18 months even as other precursors clearly signaled a buyer’s market with downward trending prices ahead.
Here’s the challenge you’re facing today. Your comparable sales will continue to be fairly accurate right now due to the lag time noted above. Nevertheless, the shrinking of the buyer pool due to the three-point jump in interest rates means that prices in many markets may have already peaked.
9 precursors that correlate with a downward trending market
There are nine precursors that alert you that falling prices may be ahead. Those nine precursors are:
- Showing activity declines.
- Days on market increases.
- Open house traffic drops off substantially.
- Multiple offers decline or virtually disappear.
- Expired listings jump significantly.
- Mortgage originations plummet.
- Properties with price reductions dramatically increase.
- Builders start to offer upgrade packages and other incentives (usually in lieu of reducing their prices.)
- Foreclosures begin to climb.
In most markets nationally, at least five of these trends are present, and in many markets, there may be at least eight.
Chasing the market down
If you live in an area where there has been very rapid price appreciation, your sellers may soon have to worry about “chasing the market down,” a situation where prices are rapidly decreasing. In a buyer’s market where prices are declining, homeowners need to price their properties under where the comparable sales say the property value is.
To illustrate this point, assume that you’re in a declining market where prices are falling 1 percent per month. Sixty days into the listing period a property priced at $500,000 would already be overpriced by $10,000. If it were to stay on the market for 180 days, it would be overpriced by $30,000.
Remember, it takes six to 12 months before actual price reductions become readily apparent in the MLS comparable sales.
For example, Realtor.com’s May report shows that price growth is still soaring in places like Miami (+45.9 percent), Nashville (+32.5 percent) and Orlando (+32.4 percent). In contrast, Austin reported the greatest increase in the number of homes with price reductions (+14.7 percentage points), followed by Las Vegas (+12.3 percentage points) and Phoenix (+11.6 percentage points).
When the number of homes with price reductions moves into double digits, those markets have most likely peaked and are becoming more vulnerable to chasing the market down.
Persuading the seller to be realistic about their price: A case study
The best strategy for coping with today’s shifting market is to learn how to incorporate the next generation of Artificial Intelligence (AI) Automated Valuation Models (AVMs) into your listing appointments. These models far exceed the limited amount of data that your MLS supplies. Moreover, they’re easy to access, they provide the data on individual homes rather than just zip codes or towns, and they are also easy for the seller to understand.
Please note, these tools are not a substitute for your experience or your MLS-based CMA. Instead, use them hand-in-hand to help your sellers price their property as accurately as possible. Here’s what to do:
Begin with a square footage CMA
If calculated properly, a traditional square footage CMA can alert you to declining prices. It’s extremely important that you follow the “10 percent rule” when selecting your comparable sales, i.e., the improvements and the lot size are both within 10 percent of the size of the subject property.
For example, on a 2,000 square foot house on a 6,000 square foot lot, you would select comparable sales where the improvements ranged in size from 1,800 to 2,200 square feet with lot sizes ranging from 5,400 to 6,600 square feet. Any property outside these parameters will cause the price to be off.
Calculate which way the market is trending
Given that the interest rates were low at the beginning of the year, it would be smart to take the average price per square foot of the comparable sales for the last 90 days and compare them to the average price per square foot from January 1, 2022, to March 31, 2022.
If the number for the first 90 days of 2022 is higher, prices in your market have probably already peaked.
Also, check your MLS to spot increases in months of inventory and days on the market, as well as increases in the number of expired listings. Increases in these are harbingers of a market slowdown.
Search for price reductions
Most MLSs allow you to search for properties where the price has been reduced. Because consumers don’t have access to your MLS to find this data, however, a more persuasive source is to use one of the AVMs such as Movoto.com, Realtor.com, or Zillow that you can access live during a listing appointment.
For example, when I searched one of the zip codes in Austin on Movoto.com, 42 out of 120 listings (35 percent) had price reductions. The amount of the price reduction is displayed in the upper left-hand corner in the white bubble with green print.
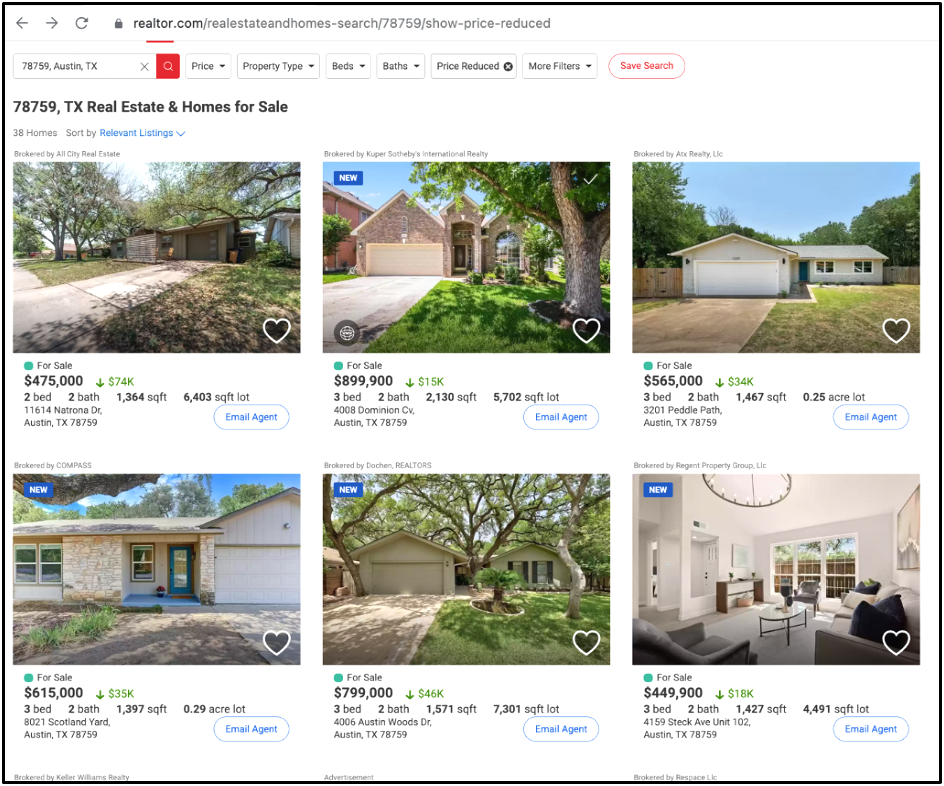
You can also use Realtor.com for this information when you search for homes. Click on “More Filters” and then “Price Reduced.”

On Realtor.com, 38 homes out of 108 total listings (35 percent) had price reductions. When the numbers from two separate AVMS agree, they’re usually correct.
Given this data, this zip code in Austin has probably already peaked since over one-third of the listings have had to reduce their price.
AI-based AVMs — a powerful new tool in your listing arsenal
When sellers are told that the market is no longer increasing in value, or worse yet, has already peaked, they probably won’t believe it. They are much more likely to believe what they see on the portals like Zillow and Redfin as opposed to what an agent tells them.
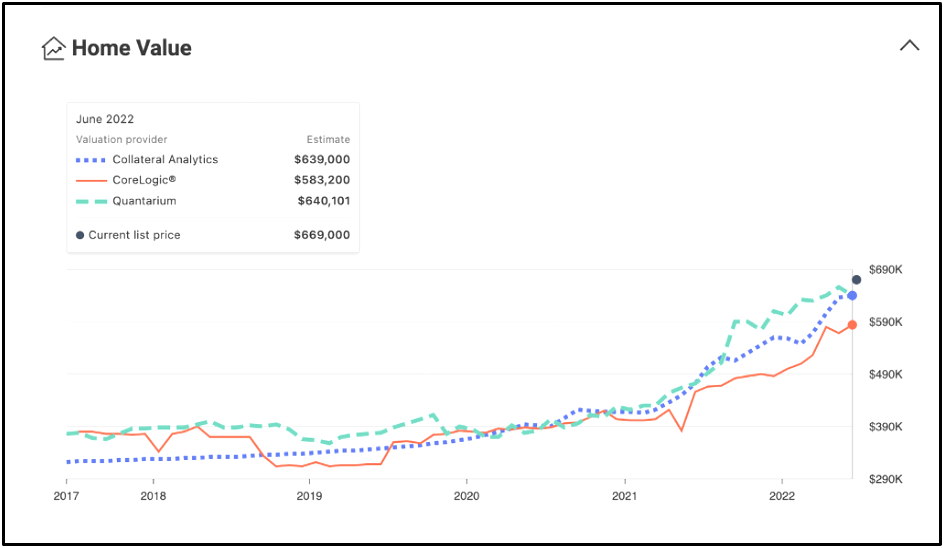
Realtor.com recently started providing a chart for specific houses, not just a zip code or city. This chart incorporates AVMs from three different sources and can be shown to sellers during your listing appointment. The chart is dynamic meaning you can see exactly where each AVM currently prices the property as well as where it was valued going back to 2017.
The three AVMs Realtor.com displays are:
- Collateral Analytics: A company that provides 12 different AVMs that are widely used by Wall Street, banks, appraisers, and other financial institutions.
- CoreLogic is one of the largest MLS providers in the U.S. This number usually reflects where the MLS comparable sales are, however, it often tends to be lower than most other valuations.
- Quantarium: in my opinion, this is currently the best AI-based AVM because it uses “computer vision” to evaluate not only current listing conditions but also evaluates over 900 features that impact the property’s value. Quantarium trained their AVM to correctly identify things like pendant lights, granite countertops, floor coverings, etc. It then factors those features into the property’s valuation.
Below is an example for one of the current listings in the Austin zip code above:

Looking at the chart above, you can see Collateral Analytics and Quantarium property valuation are essentially identical — about $640,000. When two or more AVMs agree, and especially if they also agree with your CMA, then that’s your best estimate of the property’s value today.
Also, note the small price dip in the Quantarium valuation. If this trend continues, this property peaked in price in May 2022.
The property is currently on the market at $669,000. Given that 35 percent of the properties in this zip code already have reduced their price, this property should probably be reduced in price to $650,000.
Pricing for mobile devices
The reason for changing the list price on the property above to $650,000 is due to how people search on mobile devices. Many of the portals display search parameters in $50,000 to $100,000 increments. By listing the property at $650,000, that price would generate views from those looking from $600,000 to $650,000 as well as $650,000 to $700,000.
Rocky times ahead
In the early days of previous downturns, agents had to rely on data that was 60 to 120 days old when they were helping sellers set a listing price. Using the tools cited above, you can now provide sellers with a much more in-depth and accurate analysis of their home’s value than ever before. Best of all, this data is free and is easy to access — take advantage of it!


 Are You Interested in West Eleventh Residences Miami?
 Are You Interested in ONE Park Tower by Turnberry?
 Are You Interested in Diesel Wynwood Condominium?
 Are You Interested in Five Park Miami Beach?
 Are You Interested in Cipriani Residences Miami?
 Are You Interested in Bentley Residences Miami?
 Are You Interested in Baccarat Residences Brickell?
 Are You Interested in Aria Reserve Miami?
 Are You Interested in 888 Brickell Dolce & Gabbana | Miami?
 Are You Interested in 600 Miami WorldCenter?
 Are You Interested in HUB MIAMI RESIDENCES?
 Are You Interested in WALDORF ASTORIA RESIDENCES?