Rising home prices and bargain interest rates gave homeowners an opening to tap $275 billion in home equity last year, as lenders approved $1.2 trillion in cash-out refinancings — the highest level since 2005.
Higher home prices also fueled a record $1.7 trillion in purchase loan originations, pushing overall 2021 mortgage volume to an all-time high of $4.3 trillion, according to data aggregator Black Knight’s monthly Mortgage Monitor Report.
But looking ahead, rising interest rates have created affordability issues that could slow home price appreciation, the report said. There’s also a potential for tens of thousands of distressed homes to come onto the market. As borrower protections in place during the pandemic are lifted, borrowers who are still having trouble making their mortgage payments may attempt to avoid foreclosure by selling their homes.
Purchase vs refinancing volume
Source: Black Knight Mortgage Monitor
That total includes $1.5 trillion in old-fashioned “rate and term” refinancings, where homeowners take out a new mortgage primarily to get a lower interest rate, rather than to cash out home equity.
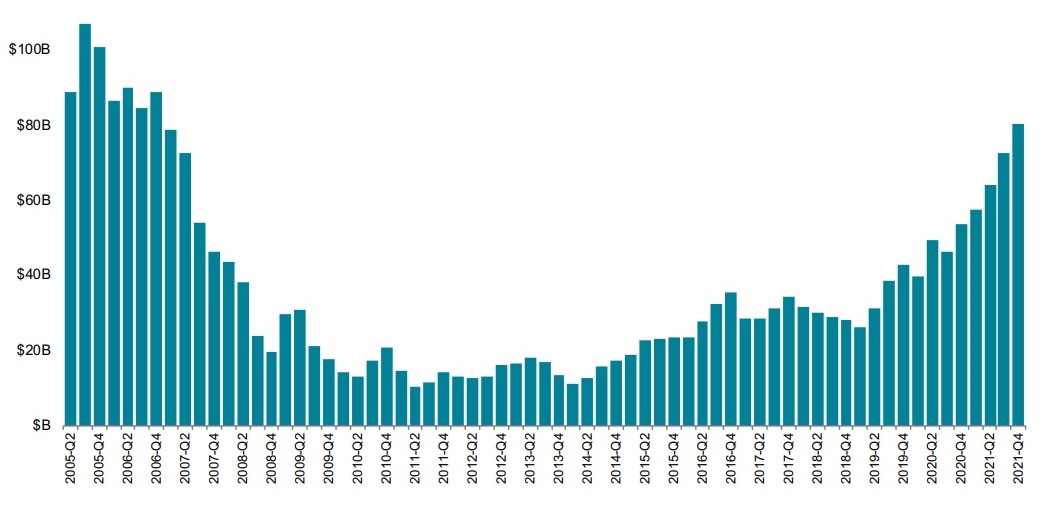
Equity cashed out when refinancing
Source: Black Knight Mortgage Monitor.
During the last three months of 2021 alone homeowners took $80 billion in equity out of their homes when refinancing. It was the fifth consecutive quarter in which lenders approved at least 1 million cash-out refis.
With interest rates rising, cash-outs accounted for 60 percent of mortgage refinancings during the fourth quarter of 2021. So far this year, rate-and-term refinancings are down 65 percent from a year ago, Black Knight said.
Cash-out refis left many homeowners vulnerable to foreclosure when home prices tanked after the last housing boom. This time around, lenders are focusing on borrowers with prime credit scores who are keeping a bigger equity stake in their homes, Black Knight Data & Analytics President Ben Graboske said.
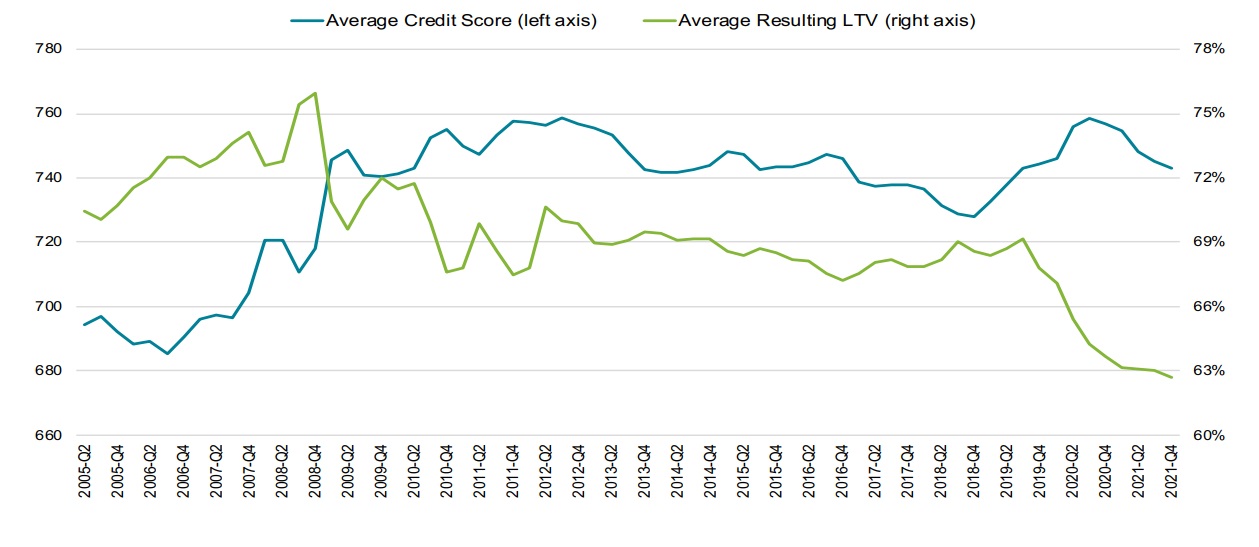
Cash-out refinancing risk profile
Source: Black Knight Mortgage Monitor
Rising home values “are resulting in much lower post-cash-out LTVs [loan-to-value ratios] than we’ve seen in recent years … while high average credit scores are also helping to lower the overall risk profile of these loans,” Graboske said in a statement.
The average credit score of borrowers approved for cash-out refinancing has slipped since the end of 2020, but still remained above 740 during the fourth quarter — well in “prime” territory.
During the Great Recession of 2007-09, loan-to-value ratios were more than 10 percentage points higher than today, Black Knight data shows.
While the boom in cash-out refis may not trigger alarm bells, the report also suggests that conditions are forming that could not only slow future price appreciation, but bring more distressed properties on the market.
National payment-to-income ratio
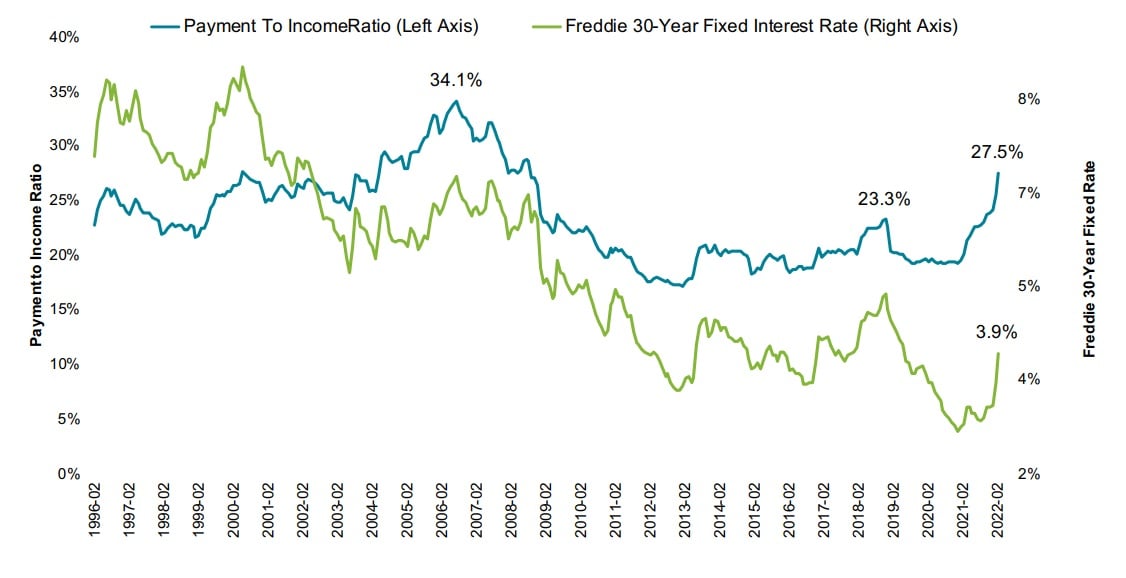
Share of median income needed to make the monthly principal and interest payment when purchasing the average-priced home with a 20 percent down payment and a 30-year fixed rate mortgage at the prevailing interest rate. Source: Black Knight Mortgage Monitor.
With interest rates also on the rise, the monthly mortgage payment for the average-priced home is up $417 from a year ago, and it now takes 27.5 percent of median household income to purchase the average home. Although that’s still well below the 34 percent payment-to-income ratio seen during the housing bubble, it’s above a long-term affordability benchmark of 25 percent, the report said.
From 2013 through 2019, a payment-to-income ratio of more than 21.5 percent resulted in home price deceleration, “a trend that’s been shattered in the post-pandemic world,” the report noted. “With home price growth reheating as it has in early 2022, affordability and housing dynamics are worth watching closely in coming months.”
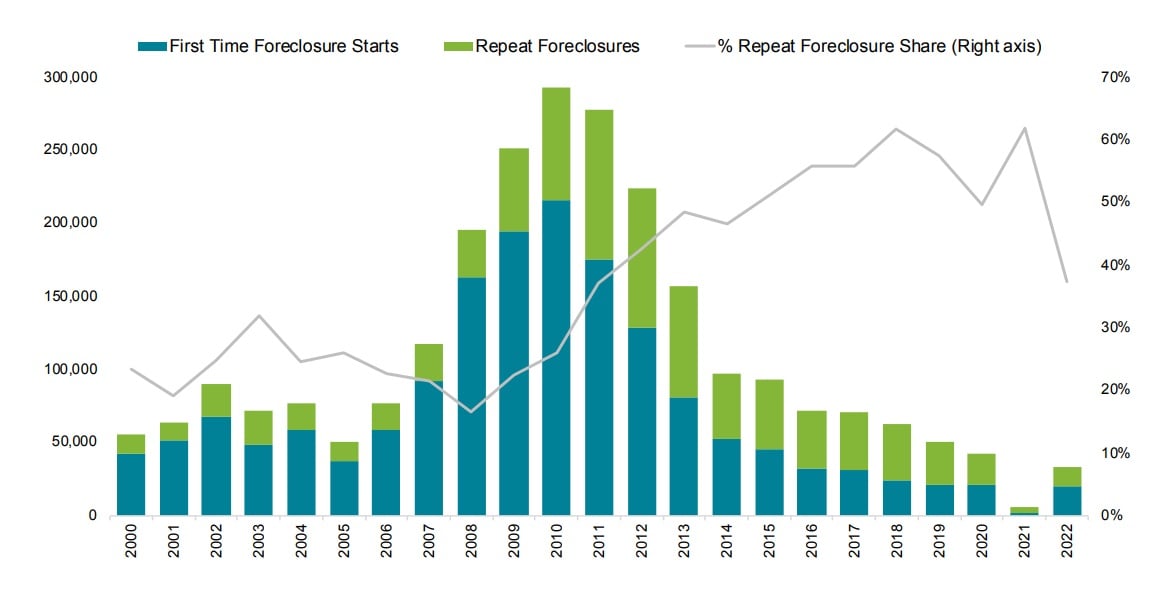
Foreclosure starts
Source: Black Knight Mortgage Monitor
Although foreclosure starts increased seven-fold in January as borrower protections that were put in place during the pandemic were lifted, they remained below pre-pandemic levels.
The 32,879 loans Black Knight estimates were referred to foreclosure during January represented a 702 percent increase from December, and a 458 percent increase from a year ago. But foreclosure starts were still down 23 percent below the pre-pandemic level of 42,834 seen in January, 2020.
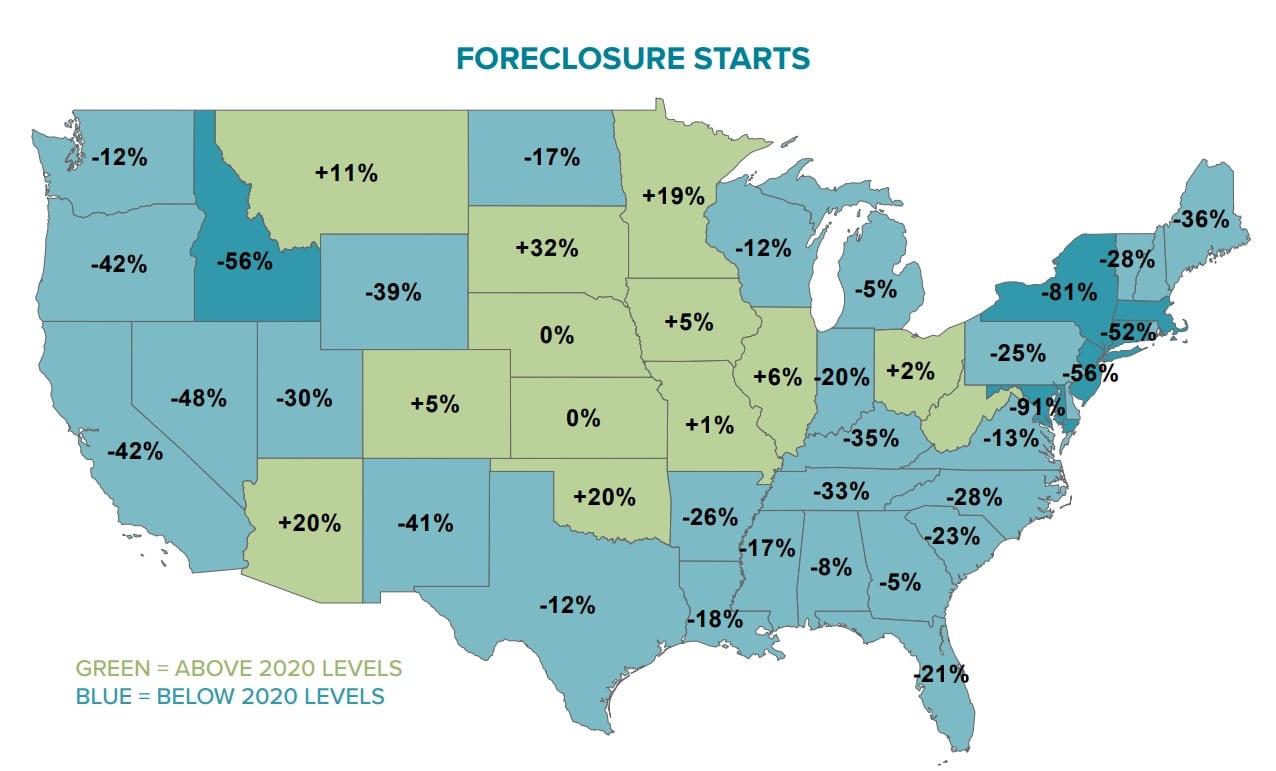
Foreclosure starts by state
Source: Black Knight Mortgage Monitor.
Foreclosure starts remain well below pre-pandemic levels in most states. Maryland, Idaho, New Jersey, Massachusetts and Connecticut all experienced January start volumes at less than half pre-pandemic levels. But some Midwestern states including Ohio, Illinois, Minnesota, Iowa are seeing elevated levels of foreclosures.
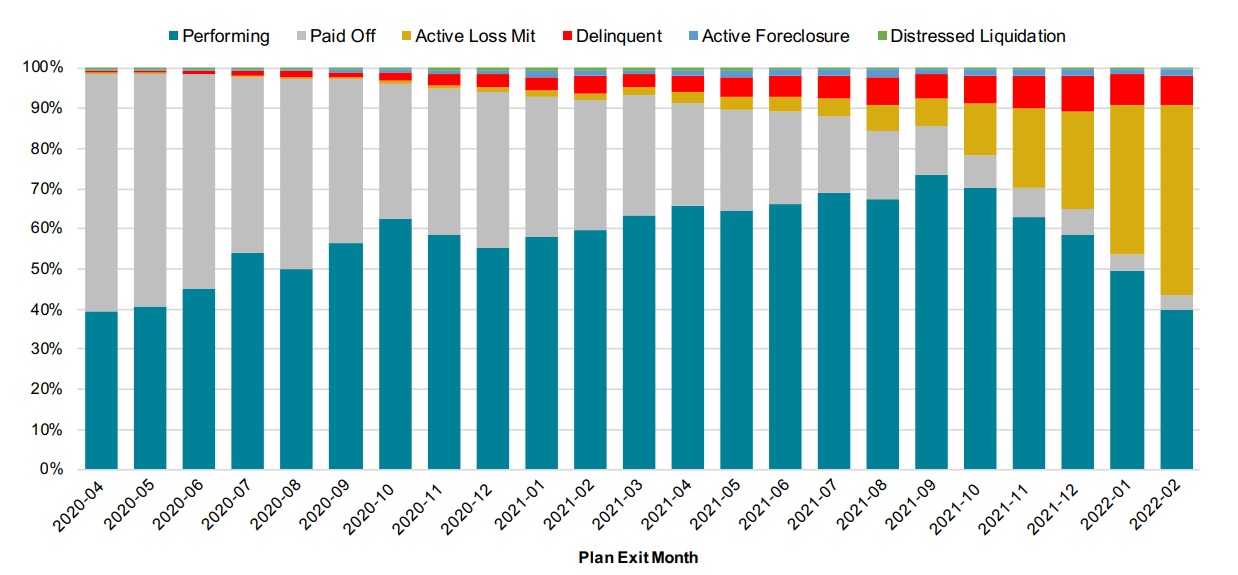
Current status of homeowners who have left forbearance
Source: Black Knight Mortgage Monitor
Most of the approximately 8 million homeowners who applied for forbearance during the pandemic are either current on their loans, or have paid off their mortgage in full. But 275,000 borrowers remain behind on their loan payments.
Among the 1.4 million homeowners who have left forbearance since the beginning of October, one in four were still in loss mitigation.
“This population is central not only to potential 2022 foreclosure risk but are also worth watching for the number of ways they may impact the housing market,” the report said. “Post-forbearance borrowers unable to come to terms with their lenders may be able to avoid foreclosure by selling their homes.”
Get Inman’s Extra Credit Newsletter delivered right to your inbox. A weekly roundup of all the biggest news in the world of mortgages and closings delivered every Wednesday. Click here to subscribe.


 Are You Interested in West Eleventh Residences Miami?
 Are You Interested in ONE Park Tower by Turnberry?
 Are You Interested in Diesel Wynwood Condominium?
 Are You Interested in Five Park Miami Beach?
 Are You Interested in Cipriani Residences Miami?
 Are You Interested in Bentley Residences Miami?
 Are You Interested in Baccarat Residences Brickell?
 Are You Interested in Aria Reserve Miami?
 Are You Interested in 888 Brickell Dolce & Gabbana | Miami?
 Are You Interested in 600 Miami WorldCenter?
 Are You Interested in HUB MIAMI RESIDENCES?
 Are You Interested in WALDORF ASTORIA RESIDENCES?